Every marketer knows the importance of being data-driven.
After all, with most of your competition being active on Twitter, you can't afford to make decisions based on guesses anymore.
You need to analyze Twitter data, and determine EXACTLY what works and doesn't work for your brand.
It all comes down to looking at the right numbers, and drawing the correct conclusion from the data.
Analyze Twitter data, and determine EXACTLY what works and doesn't work for your brand.
The ultimate goal is to know that the marketing decision you're making will work before you even implement it.
Analytics can give you that power.
But the big question is: are you ready to leverage it?
Are you ready to analyze Twitter data and use it to make data-driven decisions that will drive engagement, leads, and sales?
If your answer is "Yes," read on!
Want massive engagement, traffic, and reach? Check out these 11 Types of Content you need to be sharing on Twitter!
How to Analyze Twitter Data for Increased Results
The first thing you need to know is what tools will help you analyze your data.
Fortunately, there are quite a few platforms which let companies measure Twitter data easily and effortlessly.
Here are a few noteworthy ones:
Twitter Analytics
A few years ago Twitter Analytics was introduced, and to this day, it remains one of the easiest ways for users to analyze their data.
Twitter Analytics allows users to take the guess work out of their campaigns in order to increase their levels of success. 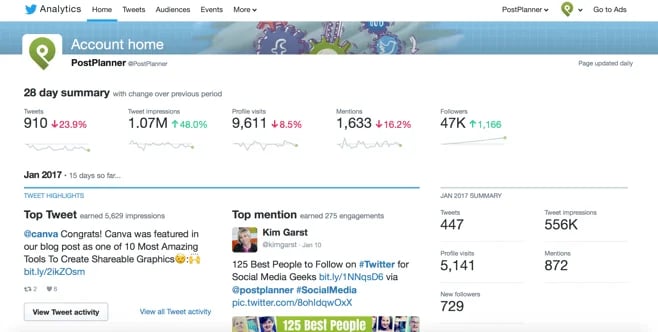
The tool breaks up the data into five categories:
- Home
- Tweets
- Audiences
- Events
- More (which includes videos, app manager and conversion tracking)
This is a fairly easy, straightforward and effective way to gain crucial data needed when analyzing a campaign.
BirdSong Analytics
This paid tool gives you access to 30 key metrics, with information presented on easy to read tables and charts.
It allows you to do your own analysis of your followers.
The tool provides a lot of useful information, including details such as follower name, URL, bio, number of followers and following, location and latest tweet, to name a few.
Birdsong has a “pay as you go” pricing structure, so you can buy the amount of reports you need - no need for monthly subscriptions.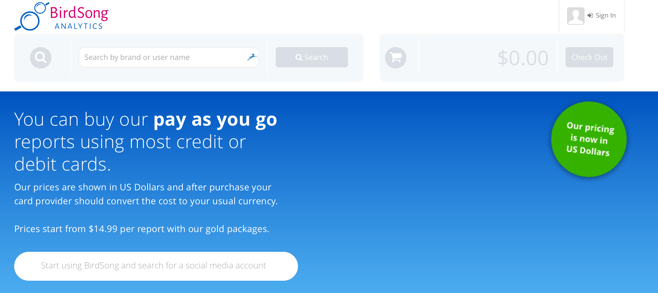
NodeXL
For those who want a simple analysis and prefer visual graphs, look no further than NodeXL.
This is a free, open-source template for Excel that pulls data from a CSV file and integrates it into a graph or diagram.
NodeXL is a helpful resource for those who enjoy visual representations of their data.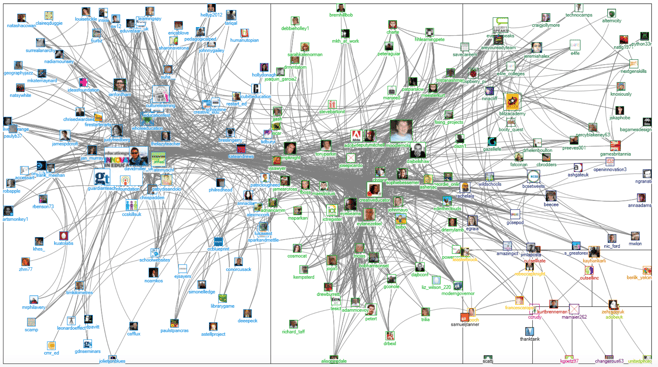
Cyfe.com
This dashboard app lets you monitor all your websites and business data from one platform.
This platform helps you pull data using pre-built widgets for Twitter.
Cyfe.com offers a free plan, or for those who want more, there is a premium option available.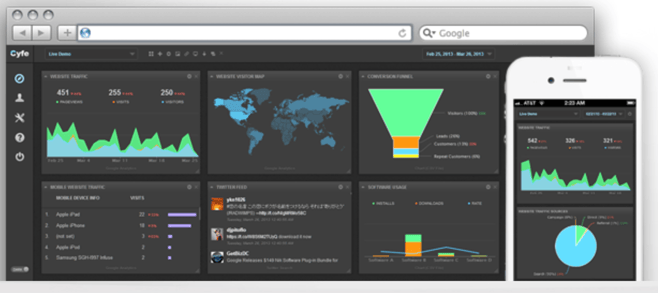
Metrics To Look At
There's A LOT of data out there and a lot of tools that can give it to you.
That may be fantastic, but how do you sift through all that data and find the metrics that really matter?
Because I've got news for you: you don't need to measure everything.
There are only a few metrics you need to keep a close eye on, as they're the ones that will give you valuable insight into your audience and your content's performance.
Track what's working and what's not, so you can make the necessary changes and get better results.Click to Tweet
Here are the metrics you need to pay attention to:
1. How Many Impressions You’re Making
If you're using Twitter Analytics, you can easily discover how many people are seeing your tweets.
It's very easy. The first step is to choose a date range.
By default, the date range is set to the last 28 days, but you are also able to select the last 7 days or specific months.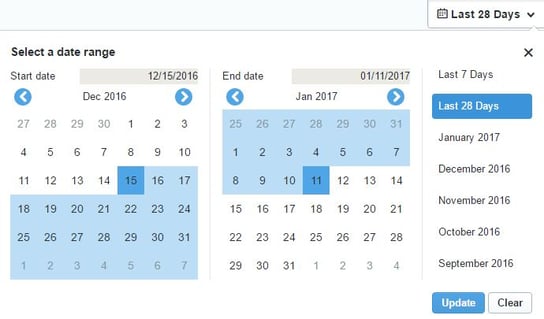
The downside to this is the largest date range you can select from is 91 days, which can be frustrating for those who wish to analyze their performance across a larger data set.
Once you have selected the date range you're interested in, you will be able to see the impressions graph. There you'll see all of your organic impressions, as well as traffic from paid ads and promoted tweets.
Look for spikes and low points and try to determine to reason behind them. Perhaps you posted some very engaging content on that day, or maybe your audience is always more active on that day of the week.
Look for patterns and use them to make conclusions.
Also, be sure to note that the bottom graph in grey demonstrates how many tweets were sent each day. Don't ignore this data. It will help you find the ultimate best time to gain impressions. 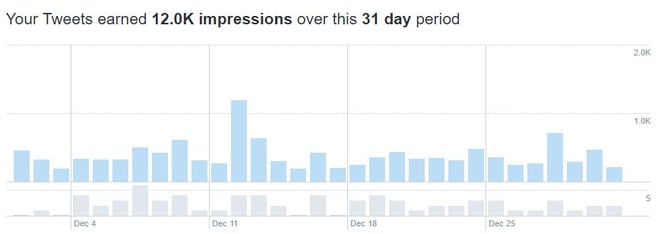
Once you have that valuable information, you can use it to change your tweeting schedule accordingly and make sure you tweet your content at the most optimal time and the best day in order to gain maximum impressions.
2. Who Your Audience Is
Every company needs to know who their target audience is, what they like, and what they need.
Have that information and you can tailor your content and your Twitter marketing strategy to those people.
Analytics are the key to gathering valuable data about your audience.
You can use analytics to get a glimpse of your audience's interests, demographics, lifestyle, mobile footprint and gender, location, language, and more.
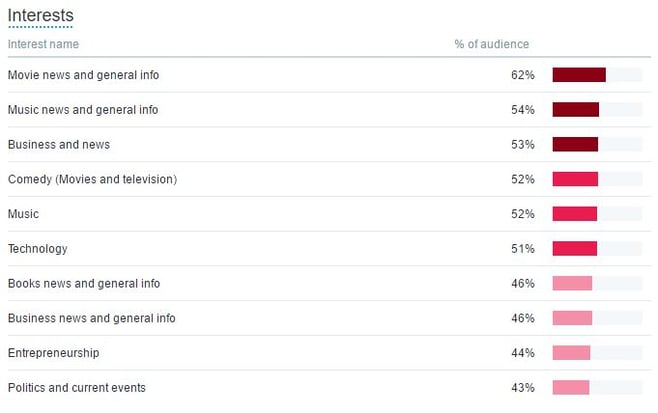
Wondering where analytics gets that info?
Twitter analytics are smart. They analyze your audiences’ tweets and uses them to tell what their interests are.
When I looked at this data, I was able to tell the majority of my audience is interested in movies, music, and business news.
It may not seem like much, but businesses can use this information to ensure their content is tailored to their audiences’ interests. Tweeting content that the audience is interested in will increase impressions, engagement and conversions.
If your business does content marketing or runs a blog, you can tailor your own content around these interests to increase page views.
It's a great opportunity to tap into.
3. When Your Audience is Online
This one is important if you’re trying to improve your impressions and engagement, or just generally promote your business.
If majority of your tweets are being posted while your audience isn’t online, you’re essentially wasting your time and effort.
One of the easiest ways to ensure your tweets get seen by the maximum audience is to do AB testing. Try publishing the same tweet several times a day and see when it performs the best.
This way, you'll have a bigger chance to gain impressions from people in different time zones.
Of course, you probably won't want to post the same tweet over and over again on the same day, as that can look spammy and cause you to lose followers.
What you can do is test it out over a period of a week or more. For example: post the same tweet at 8AM on Monday, 10 AM on Tuesday, 11AM on Wednesday, and so on.
OR you can just use a few Twitter tools to find out when your followers are most active on Twitter.
There are many tools that will give you a detailed break-down of the best time to tweet, and here are a few of them:
Tweriod
This tool analyzes your tweets and your followers’ tweets.
It then breaks the data down to a day-to-day basis, showing you what time on which day will get you maximum exposure.
Followerwonk
This free Moz app lets you get an inside look at your followers. Simply type in the Twitter handle of your business account and you will see numerous graphs.
There is even a world map that will shows you where your followers are located, and the most active hours for followers and your account.
For example, Followerwonk’s data shows my followers are mostly active between 10am and 11am. That means that in order to increase results, I need to publish my best content within this timeframe. 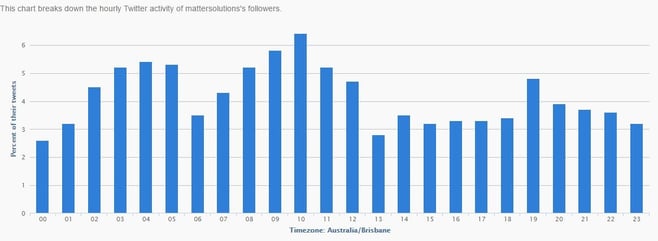 For many companies, it is not sustainable to manually post tweets throughout the day, especially outside of business hours.
After all, your target audience might be spread out all over the globe and you definitely don't want to wake up in the middle of the night just to post at the optimal time.
To solve this problem, you can use Post Planner to create a custom posting schedule and set your posts to go out at the best time.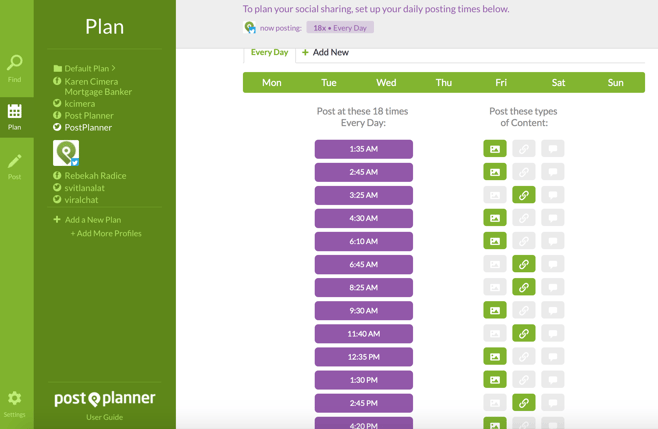
In fact, Post Planner offers you several options. You can select "Add to Plan" and have your post added to the top or bottom of your custom posting schedule.
OR you can schedule your content to post on a specific day and time that's outside of your posting schedule.
You can even chose to have that piece of content set to "Recycle" or "Repeat" every day, week, or month. 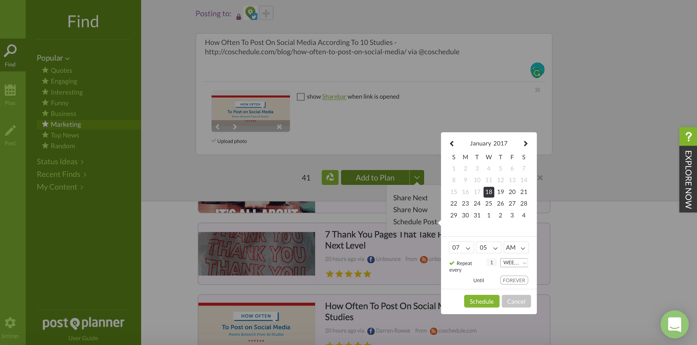
But don't just automate and forget about it - make sure to come in and engage with your followers.
4. Engagement
Engagement is the most important metric of them all. It's actionable, easy to measure, understand, and do AB testing on.
Likes, retweets, comments, and clicks, all provide you with a clear picture of what type of content your fans are consuming.
The great news is that Twitter Analytics gives you a nice breakdown of your engagement.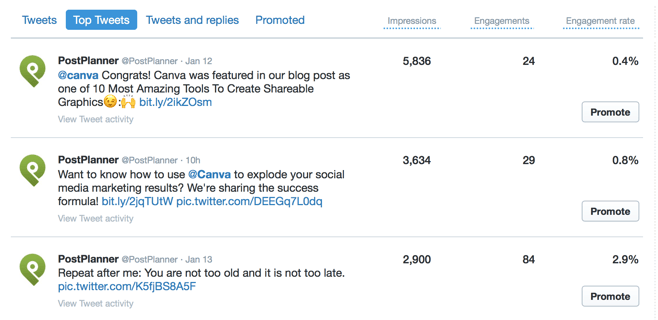
Just look in the "Tweets" category and you will see how much engagement you’re getting for each tweet. You can also see your top tweets with the highest amount of engagement.
Analytics provides a visual breakdown of engagement. It shows the engagement rate, link, clicks, retweets, likes and replies.
Always give preference to content that gets the most engagement.
If you don't know where to find the most engaging content, know that you can always use Post Planner to find the most engaging content on the web.
Simply look in the "Popular" Section under FIND and you'll see hundreds of engaging images and blog posts - all ranked by virality. 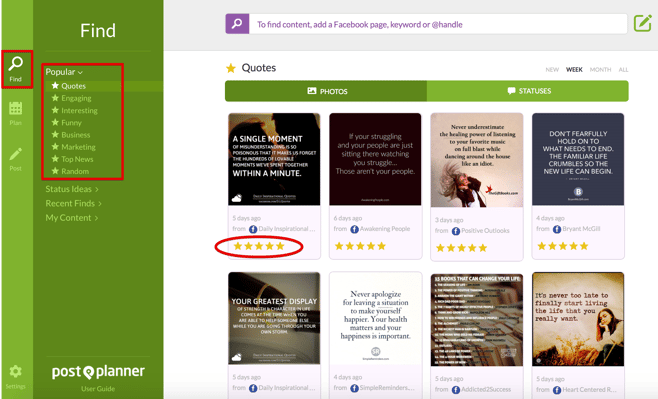
Once that content is shared, take a good look at the breakdown of engagement on each tweet. This will let you see which type of tweet is the most successful and what your followers will respond well to.
The graph can also give you a rough gauge of what day and time receives the most engagement.
So, look at what type of content, length of tweet, or time posted gets the most engagement. There are hundreds of factors you can test out in this way.
The engagement graph will provide you with a clear picture of what is working and what's not.
Interpret those results and act on them. Use them to make data-driven changes to your Twitter strategy.
5. Success of Your Paid Tweets
If you’re spending money on Twitter through promoted tweets or advertisements, you’re going to want to know if it’s worth it.
Using Twitter Analytics, you can easily access this information under the "Tweets" category.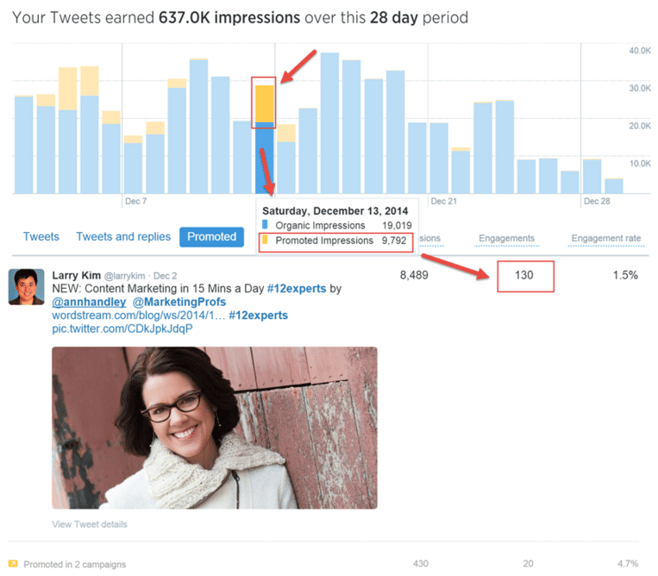
(Source: Wordstream)
Once you've selected a timeframe, you will see the number of impressions for a promoted tweet, as shown in yellow on the graph.
Going off Wordstream’s data, you can see the promoted impressions are far less than the organic impressions.
This result demonstrates that you should either spend more on promotional tweets, or choose a completely different tweet to promote.
This highlights how important data is to the restructuring of a businesses campaign in order to achieve results.
Businesses will be able to interpret their own data and increase or decrease money spent on promoted tweets to improve their bottom line.
Final Thoughts
Without analytics, we can only stumble around blindly and make decisions based on guesses and assumptions.
You can't afford that.
If you want success, you need to be data-driven and analyze Twitter data correctly and frequently.
This will let you to get a clear picture of what is and isn’t working.
As a result, you can then alter your social media campaign strategy accordingly, and achieve impressive results.




ViewHide comments (2)